Note
Go to the end to download the full example code.
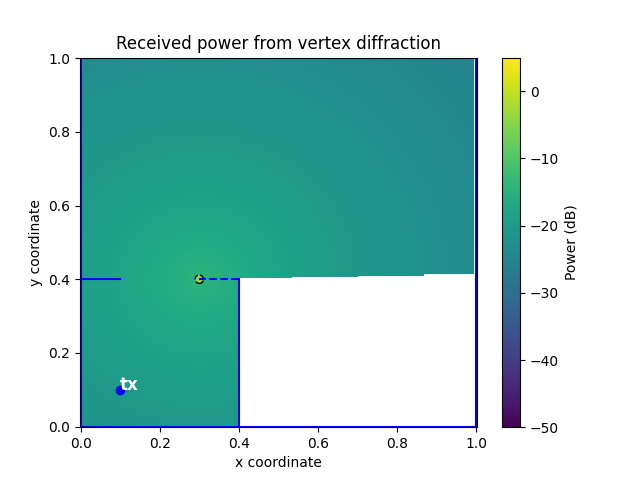
Plot received power from vertex diffraction over a grid
This example shows how one can plot the received power map, i.e., the power received at each (x, y) coordinate as the sum of the power from each transmitter.
At the center of the scene, two vertices a placed for diffraction.
Imports
First, we need to import the necessary modules.
import equinox as eqx
import jax
import jax.numpy as jnp
import matplotlib.pyplot as plt
from jaxtyping import Array, Float

from differt2d.geometry import FermatPath, Vertex
from differt2d.scene import Scene
from differt2d.utils import P0, received_power
Scene
We construct a very simple scene, and add one vertex from one of the walls.
scene = Scene.basic_scene()
wall = scene.objects[-2]  # A ref. to this wall is important, see later
_, vertex = wall.get_vertices()
scene = scene.add_objects(vertex)
Plot setup
Below, we setup the plot. Note that we only generate first-order paths, not the line-of-sight, to better illustrate the effect of the diffraction.
Warning
Because diffraction occurs on the edge(s) of objects, this can be problematic when we check if the path does not intersect with other objects, because the ray path will always intersect with the wall that the vertex originates from.
We propose two solutions to this problem:
remove the corresponding wall from the scene, using
Scene.filter_objects<differt2d.scene.Scene.filter_objects(if the vertex touches is shared with multiple walls, you need to remove all of them);or use the
patchargument to virtually reduce the size of all the objects. This, however, can also create some side effects as the rays will now be able to pass in place where it is not physically valid.
If you have a better solution, please reach out to us!
fig, ax = plt.subplots()

annotate_kwargs = {"color": "white", "fontsize": 12, "fontweight": "bold"}

key = jax.random.PRNGKey(1234)
X, Y = scene.grid(300)

scene = scene.filter_objects(
    lambda obj: not eqx.tree_equal(obj, wall),  # We remove the 'wall' from the scene
)

scene.plot(
    ax,
    transmitters_kwargs={"annotate_kwargs": annotate_kwargs},
    receivers=False,
)
wall.plot(ax, linestyle="--")

P: Float[Array, "300 300"] = scene.accumulate_on_receivers_grid_over_paths(
    X,
    Y,
    fun=received_power,
    order=1,
    filter_objects=lambda obj: isinstance(obj, Vertex),  # Vertex diffraction
    path_cls=FermatPath,
    reduce_all=True,
    key=key,
)  # type: ignore

PdB = 10.0 * jnp.log10(P / P0)

im = ax.pcolormesh(X, Y, PdB, vmin=-50, vmax=5, zorder=-1)
cbar = fig.colorbar(im, ax=ax)
cbar.ax.set_ylabel("Power (dB)")

ax.set_xlabel("x coordinate")
ax.set_ylabel("y coordinate")
ax.set_title("Received power from vertex diffraction")

plt.show()  # doctest: +SKIP
Total running time of the script: (0 minutes 1.050 seconds)