Note
Go to the end to download the full example code.
Plot received power with RIS over a grid
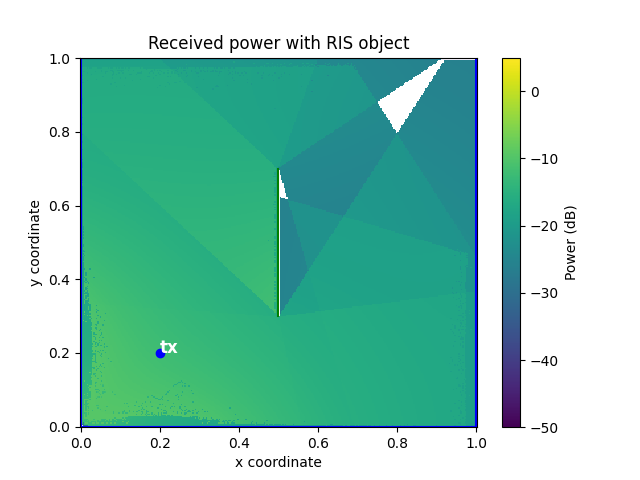
This example shows how one can plot the received power map, i.e., the power received at each (x, y) coordinate as the sum of the power from each transmitter.
At the center of the scene, a reconfigurable intelligent surface (RIS)
is placed, using the RIS class. The
model is very simple, as it amounts to force the reflection angle
to be fixed to some angle phi.
Imports
First, we need to import the necessary modules.
import jax
import jax.numpy as jnp
import matplotlib.pyplot as plt
from jaxtyping import Array, Float

from differt2d.geometry import RIS, MinPath
from differt2d.scene import Scene
from differt2d.utils import P0, received_power
Scene
We construct a very simple scene, and add some RIS wall that should reflect any incident ray with a reflection angle of 45°.
Plot setup
Below, we setup the plot. Note that we only generate first-order paths, not the line-of-sight, to better illustrate the effect of the RIS.
fig, ax = plt.subplots()

annotate_kwargs = {"color": "white", "fontsize": 12, "fontweight": "bold"}

key = jax.random.PRNGKey(1234)
X, Y = scene.grid(300)

scene.plot(
    ax,
    transmitters_kwargs={"annotate_kwargs": annotate_kwargs},
    receivers=False,
)

P: Float[Array, "300 300"] = scene.accumulate_on_receivers_grid_over_paths(
    X,
    Y,
    fun=received_power,
    path_cls=MinPath,
    min_order=1,
    reduce_all=True,
    path_cls_kwargs={"steps": 1000},
    key=key,
)  # type: ignore

PdB = 10.0 * jnp.log10(P / P0)

im = ax.pcolormesh(X, Y, PdB, vmin=-50, vmax=5, zorder=-1)
cbar = fig.colorbar(im, ax=ax)
cbar.ax.set_ylabel("Power (dB)")

ax.set_xlabel("x coordinate")
ax.set_ylabel("y coordinate")
ax.set_title("Received power with RIS object")

plt.show()  # doctest: +SKIP
Total running time of the script: (0 minutes 4.683 seconds)